Stay up-to-date.
Would you like these weekly financial recaps personally delivered to your email inbox? Sign up here:
Human-Centric Wealth Management™
Last week, there was nothing surprising in economic and financial news.
Inflation eased, as expected, although it remained above the Federal Reserve (Fed)’s target rate. The Treasury yield curve remained inverted with three-month Treasury bills yielding more than 10-year Treasury notes. This condition has been in place since November 2022. Also, we may be nearing an end to rate hikes around the world.
With the first signs of dents in economic growth now visible, and fallout from financial-market tensions lingering, any pause by the Federal Reserve after at least one more increase in May could cement a turn in what has been the most aggressive global tightening cycle in decades.
Bloomberg News
Recession predictions for the United States continue to be prominent and varied, ranging from no recession to mild recession to deep recession over the next three to 18 months, reported Rafael Nam and Greg Rosalsky of NPR.
Minutes from the Fed’s March meeting were released last week, and they show that Federal Open Market Committee members think tightening credit conditions could result in a mild recession later this year with recovery following in 2024 and 2025.
While the idea of an economic downturn can be unnerving, recessions are part of every economic cycle. In times of uncertainty, it can help to step back and look at the big picture: the United States is quite remarkable.
Nearly four-fifths of Americans tell pollsters that their children will be worse off than they are. In fact, America has sustained its decades-long record as the world’s richest, most productive and most innovative big economy. Indeed, it is leaving its peers ever further in the dust…American firms own more than a fifth of patents registered abroad, more than China and Germany put together.
Zanny Minton Beddoes,The Economist
Economic and market uncertainty persists in the United States and elsewhere. We may experience a recession this year. We may not. Either way, it is important to keep the big picture in mind. Recessions are one part of the economic cycle – expansions are another.
Last week, major U.S. stock indices finished higher, reported Nicholas Jasinski of Barron’s. In the Treasury market, yields on many maturities moved higher over the week.
Stocks have continued to stage a rally off the mid-March lows, so much so that multiple rare and potentially bullish signals have been triggered. By themselves, any one of these signals could be noise. But when they start to stack up, it may mean stocks want to move higher.
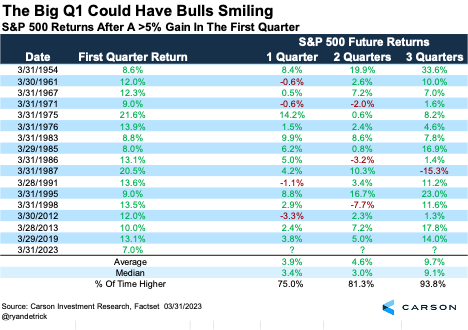
The first signal is the S&P 500 had its best first quarter since 2019, up 7.0%, which came on the heels of a 7.1% gain the previous quarter. Big first quarters often lead to continued gains. Out of 16 first quarters that gained at least 5%, the final three quarters of the year finished higher 15 times. The one outlier was 1987, which might raise a flag for some. Until then, the strong first quarter is just another clue the bulls could have a nice 2023.
The second positive sign is the overall market is being led higher by a wide range of stocks. We wrote last week how more than 93% of all stocks tracked by Ned Davis Research recently climbed above their 10-day moving averages. This rare sign of strength has led to higher prices for the S&P 500 23 out of 24 times one year later with an average return of 18.4%.
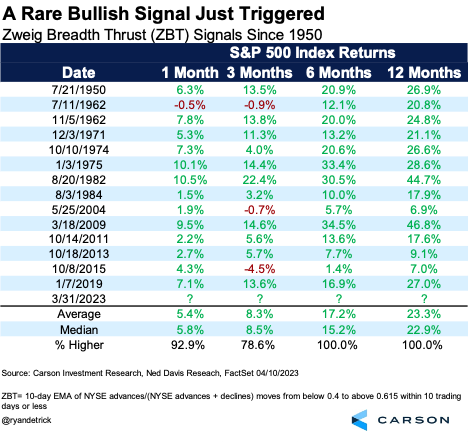
Finally, the Zweig Breadth Thrust (ZBT) indicator has been triggered, a rare and potentially bullish signal. The ZBT was coined by Marty Zweig, who is known as one of the best traders. The ZBT examines all stocks on the NYSE, tracking periods when extremely oversold stocks become extremely overbought in a short timeframe. A washout followed by heavy buying tends to open the door to higher prices.
The table below shows the previous 14 ZBTs and what followed. The S&P 500 was higher a year later every time — 14 out of 14 times and up 23.3% on average.
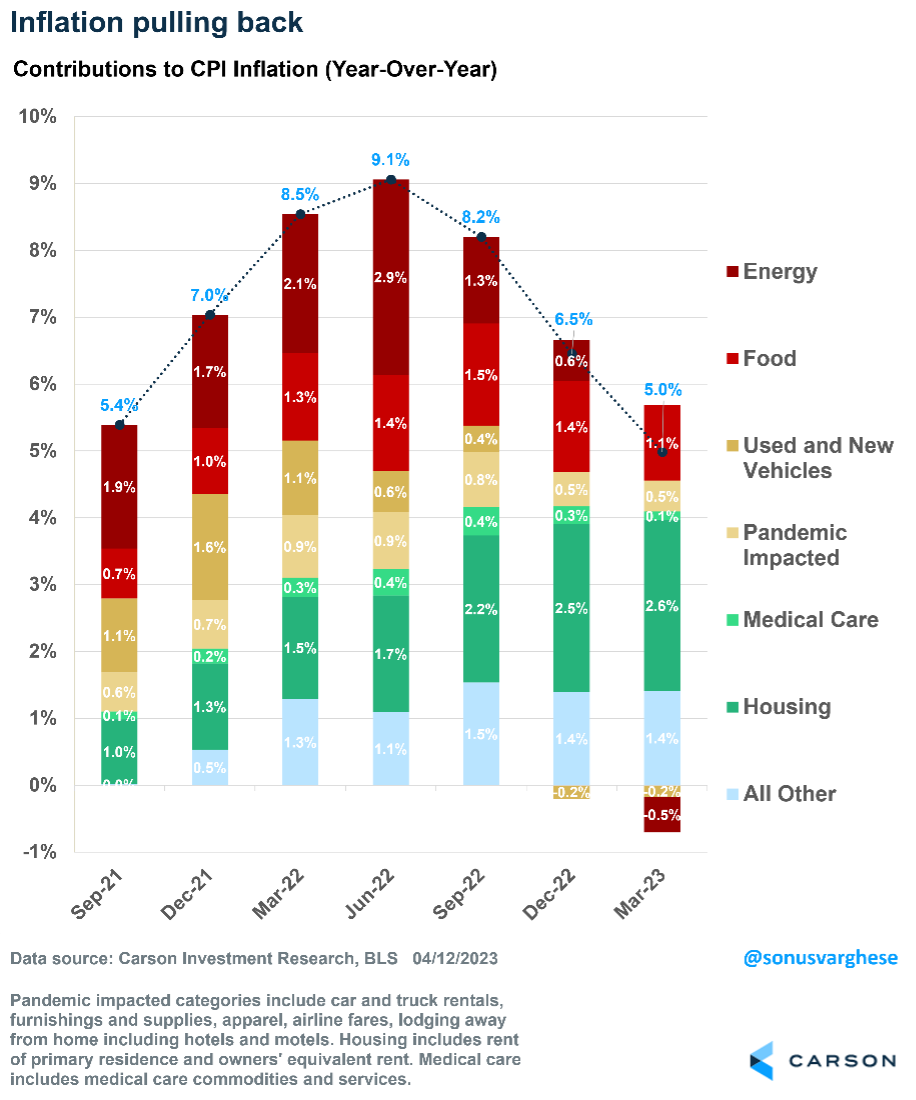
The March inflation report showed CPI inflation rose only 0.1%, slightly below expectations. Over the past year, inflation has risen 5%, well off the peak of 9% from June 2022. As the chart below shows, declining energy and food prices have pushed inflation down.
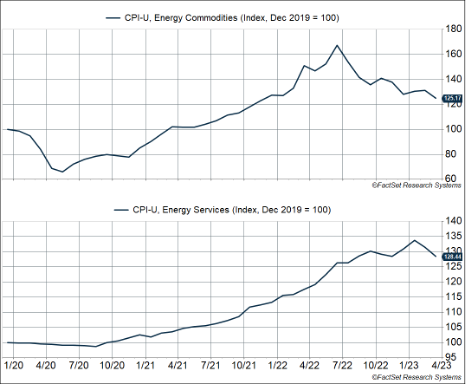
Energy makes up about 7% of the inflation basket, split almost equally into commodities, such as gasoline, and services, such as electricity and piped gas. Thanks to the pullback in oil prices, energy commodity prices are now below where they were in December 2021. The recent drop in natural gas prices has also sent services prices lower over the past couple of months.
Further good news: Prices for “food at home” i.e., groceries, fell 0.3% in March. This is the first price decline since September 2020 and bodes well for prices at restaurants, which are still elevated.
Lower Energy and Food Prices is a Big Deal for Consumption
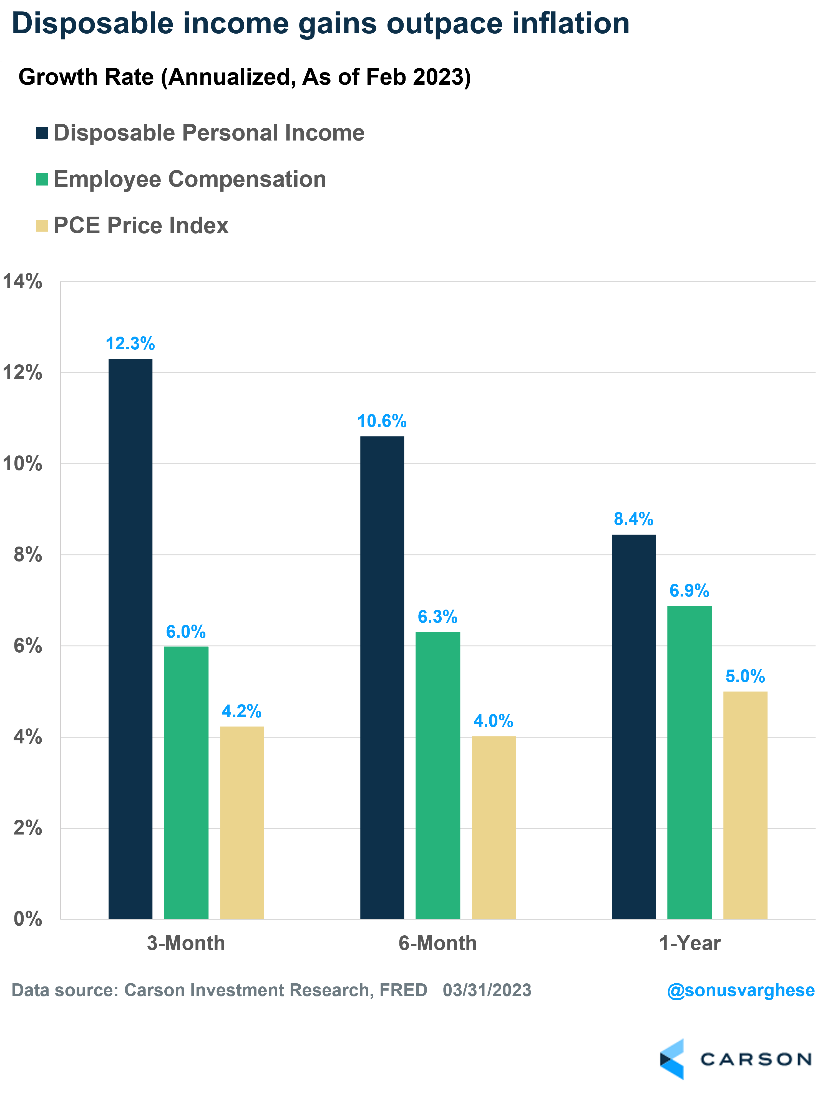
Lower inflation, by way of lower energy and food prices, means real incomes, i.e., incomes adjusted for inflation, remain strong. Stable incomes are dependent on a healthy labor market, which appears to be holding up.
The chart below shows annualized growth rates of disposable income, employee compensation (across all workers in the economy), and inflation. Over the past three, six, and 12 months, disposable income has run ahead of inflation. This is partly because Social Security incomes received an inflation-adjusted boost in January. But even employee compensation is running ahead of inflation. That’s positive for consumer spending, which makes up 70% of the economy.
The Big Story: Housing Inflation May Finally be Falling
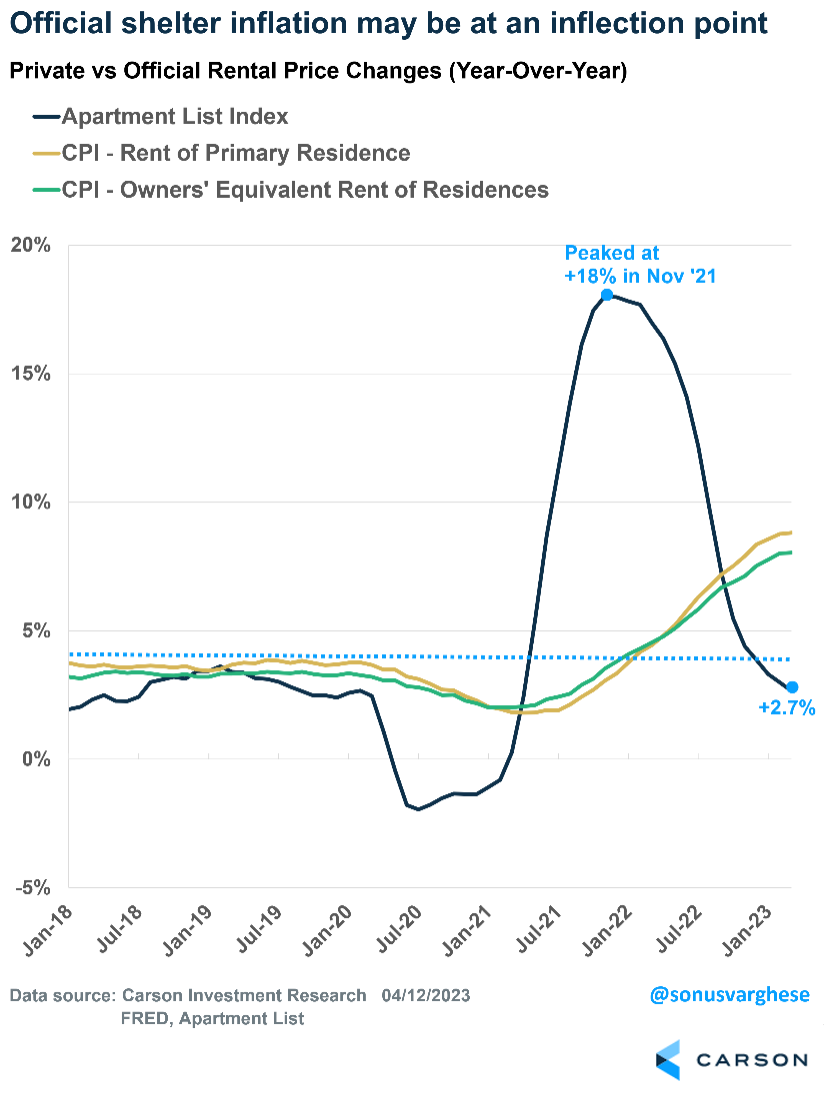
Core inflation, excluding food and energy, rose 0.4% in March. Over the past three months, core inflation has risen 5.1% (annualized pace) and is up 5.6% over the year. The modest slowdown is partly due to housing inflation running high.
There’s good news on that front. Rents of primary residences and owners’ equivalent rent (rental equivalent of owner-occupied homes) rose 0.5%. While still high, that pace is the slowest monthly increase in a year. Over the past nine months, housing inflation averaged about +0.7% per month, which translates to a whopping 9% annualized rate!
So, the slowdown in March is significant.
Market rents have already sharply decelerated. But the official inflation data has been slow to catch up to that reality. That may be changing now, which suggests core inflation may slow down the rest of this year.
The Bad News: Core Inflation Ex Housing Remains Elevated
The slowdown in energy, food, and housing inflation is the good news. The bad news is other sectors remain elevated.
Vehicle prices are no longer falling as fast as they were. Falling vehicle prices, especially for used cars, pulled inflation lower over the last few months. In March, used car prices fell 0.9%, which is the smallest decline in seven months. Private data suggests used car prices are rising again. New vehicle prices also rose 0.4%, breaking a recent downward trend.
Outside of vehicles, many goods and services that were initially hit by the pandemic are experiencing significant price increases. These include goods, such as household furnishings and apparel, and services, such as hotels and airline fares.
Other services, such as day care, personal care, and recreation, are also seeing inflation well above pre-pandemic levels.
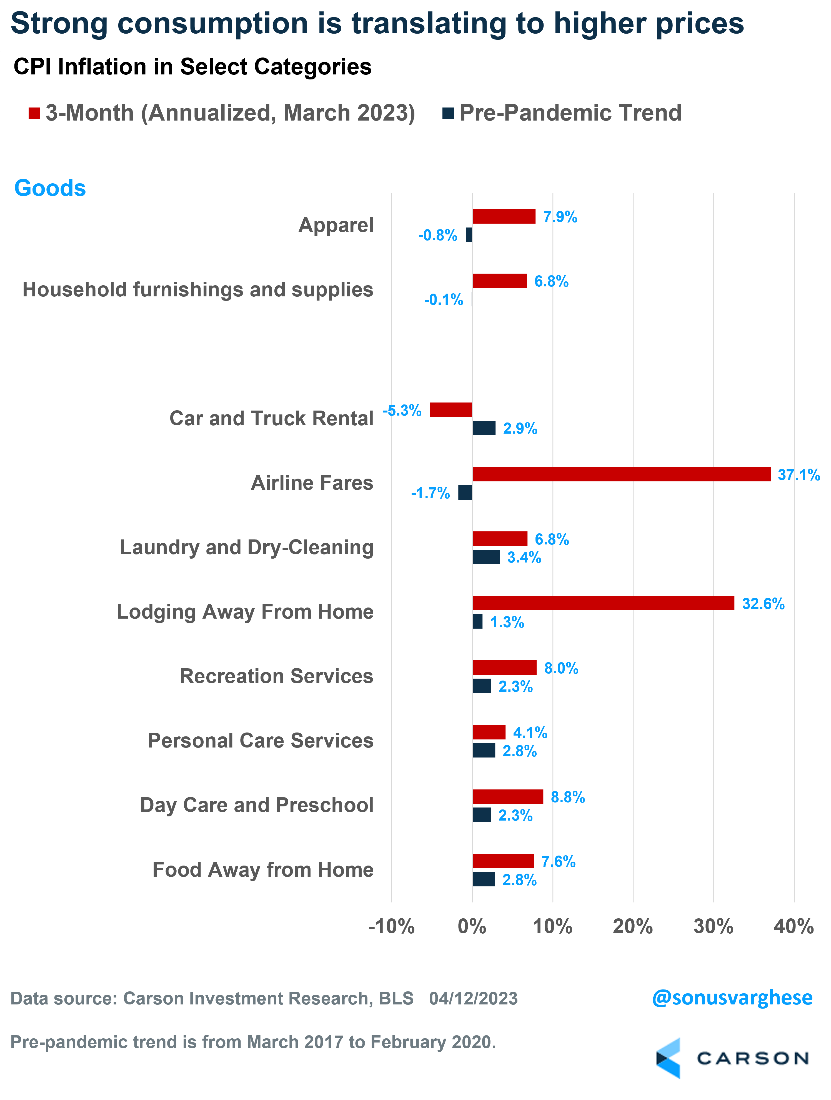
Stubborn inflation in these areas indicates demand for goods and services remains strong.
What Does This Mean for the Fed?
Fed officials have explicitly said they want to see core services ex housing decelerate. They’re looking at inflation excluding energy, food, and housing, the three categories that have had positive news. Unfortunately, there’s not much evidence that inflation in the Fed’s preferred category is decelerating yet. But the good news is that it tends to be correlated to wage growth, and there’s strong evidence that wage growth is moving closer to pre-pandemic levels.
The Fed may not continue to raise interest rates much higher, especially since the banking crisis, which prompted caution and, pushed banks to tighten credit, which is akin to rate increases. Fed officials could keep rates where they are until they see convincing evidence of inflation falling, especially in core services ex housing.
This is not what investors expect. Investors expect the Fed to start cutting rates in late summer, pricing in at least three rate cuts by the end of 2023. That indicates bond investors believe a crisis or recession is likely in the near term, which is clearly not where Fed officials are right now.
In late March, the Nemo Science Museum in Amsterdam unveiled a remarkable exhibit, featuring a prehistoric alternative to beef, reported Helen Chandler-Wilde of Bloomberg. The not-for-consumption, lab-cultured display featured:
…a cantaloupe-size globe of overcooked meat perspiring under a bell jar. This was no ordinary spaghetti topper: It was a woolly-mammoth meatball, created by an Australian lab-grown-meat company...using real mammoth DNA.
Yasmin Tayag, The Atlantic
The meatball was made by combining genetic material found in mammoths with elephant DNA, reported Bloomberg. It’s not the first time a food product has been made from a long extinct species. In 2018, a company produced mastodon gummy bears using gelatin made with mastodon DNA.
The mammoth meatball is intended to draw attention to cultured meat. That’s the most palatable marketing term for cellular protein farming.
The meat is grown in anything from a test tube to a stainless-steel bioreactor. The process is borrowed from research into regenerative medicine, and in fact [Proffesor] Mark Post of Maastricht University, who cultured the world’s first burger in 2013, was previously working on repairing human heart tissue.
Amy Fleming, BBC Science Focus Magazine
Cultured chicken is already being served in Singapore, and the company that produces it has applied for approval in the United States.
It’s unclear whether cultivating meat in labs will be more environmentally friendly than traditional farming, but it’s a growing segment of the biotechnology industry.
If you are a resident of Montgomery County, Maryland, use the link below to determine if you have filed a homestead application and are eligible to receive the tax credit.
montgomerycountymd.gov/Finance/homestead.html
Per the Montgomery County Department of Finance, over 85,000 properties do not currently have a Homestead application on file and are at risk of losing the credit.
If you have questions, please contact us.
April 17, 1970: Apollo 13 Returns to Earth
With the world anxiously watching, Apollo 13, a U.S. lunar spacecraft that suffered a severe malfunction on its journey to the moon, safely returned to Earth on April 17, 1970.
On April 11, the third manned lunar landing mission was launched from Florida, carrying astronauts James A. Lovell, John L. Swigert and Fred W. Haise. The mission was headed for a landing on the Fra Mauro highlands of the moon. However, two days into the mission, disaster struck 200,000 miles from Earth when oxygen tank No. 2 blew up in the spacecraft. Swigert reported to mission control on Earth, “Houston, we’ve had a problem here,” and it was discovered that the normal supply of oxygen, electricity, light and water had been disrupted.
The landing mission was aborted, and the astronauts and controllers on Earth scrambled to come up with emergency procedures. The crippled spacecraft continued to the moon, looped around it, and began a long, cold journey back to Earth.
The astronauts and mission control were faced with enormous logistical problems in stabilizing the spacecraft and its oxygen supply, as well as running on batteries due to the loss of the fuel cells to allow successful reentry into Earth’s atmosphere. Navigation was another problem, and Apollo 13's course was repeatedly corrected with dramatic and untested maneuvers. On April 17, tragedy turned to triumph as the Apollo 13 astronauts touched down safely in the Pacific Ocean.
Advances are made by answering questions. Discoveries are made by questioning answers.
Bernard Haisch, Astrophysicist
Rice is great when you’re hungry and you want two thousand of something.
Mitch Hedberg, Comedian
Investment advisory services offered through SPC Financial® (SPC). *Tax services and analysis are provided by the related firm, Sella & Martinic (S&M), through a separate engagement letter with clients. SPC and S&M do not accept orders and/or instructions regarding your investment account by email, voicemail, fax or any alternative method. Transactional details do not supersede normal trade confirmations or statements.
Email through the Internet is not secure or confidential. SPC and S&M reserve the right to monitor all email. Any information provided in this message has been prepared from sources believed to be reliable, but is not guaranteed by SPC or S&M, their owners or employees, and is not a complete summary or statement of all available data necessary for making a financial decision.
Any information provided is for informational purposes only and does not constitute a recommendation. SPC and S&M, including their owners or employees may own securities mentioned in this email or options, rights, or warrants to purchase or sell these securities.
SPC does not provide tax or legal advice. Before making a legal, investment, or tax decision, contact the appropriate professional. Any tax information or advice contained in this message is confidential and subject to the Accountant/Client Privilege.
This email is intended only for the person or entity to which it is addressed and may contain confidential and/or privileged material. Any review, retransmission, dissemination, or other use of, or taking of any action in reliance upon, this information by persons or entities other than the intended recipient is prohibited. If you received this message in error, please notify the sender and delete the material from your computer immediately. SPC and S&M shall not be liable for the improper or incomplete transmission of the information contained in this communication or for any delay in its receipt or damage to your system.
Portions of this newsletter were prepared by Carson Group Coaching. Carson Group Coaching is not affiliated with SPC or S&M. The information contained in this report does not purport to be a complete description of the securities, markets, or developments referred to in this material. The information has been obtained from sources considered to be reliable, but we do not guarantee that the foregoing material is accurate or complete. Any information is not a complete summary or statement of all available data necessary for making an investment decision and does not constitute a recommendation. This information is not intended as a solicitation of an offer to buy, hold, or sell any security referred to herein. There is no assurance any of the trends mentioned will continue in the future.
Any expression of opinion is as of this date and is subject to change without notice. Opinions expressed are not intended as investment advice or to predict future performance. Economic forecasts set forth may not develop as predicted and there can be no guarantee that strategies promoted will be successful. Past performance does not guarantee future results. Investing involves risk, including loss of principal. Consult your financial professional before making any investment decision. Stock investing involves risk including loss of principal. Diversification and asset allocation do not ensure a profit or guarantee against loss. There is no assurance that any investment strategy will be successful.
The S&P 500 is an unmanaged index of 500 widely held stocks that is generally considered representative of the U.S. stock market. The Dow Jones Industrial Average (DJIA), commonly known as "The Dow" is an index used to measure the daily stock price movements of 30 large, publicly owned U.S. companies. The NASDAQ composite is an unmanaged index of securities traded on the NASDAQ system.
The MSCI ACWI (All Country World Index) is a free float-adjusted market capitalization weighted index that is designed to measure the equity market performance of developed and emerging markets. As of June 2007, the MSCI ACWI consisted of 48 country indices comprising 23 developed and 25 emerging market country indices. Bond prices and yields are subject to change based upon market conditions and availability. If bonds are sold prior to maturity, you may receive more or less than your initial investment. There is an inverse relationship between interest rate movements and fixed income prices. Generally, when interest rates rise, fixed income prices fall and when interest rates fall, fixed income prices rise.
The Bloomberg Barclays US Aggregate Bond Index is a market capitalization-weighted index, meaning the securities in the index are weighted according to the market size of each bond type. Most U.S. traded investment grade bonds are represented.
Please note, direct investment in any index is not possible. Sector investments are companies engaged in business related to a specific sector. They are subject to fierce competition and their products and services may be subject to rapid obsolescence. There are additional risks associated with investing in an individual sector, including limited diversification.
Third-party links are being provided for informational purposes only. SPC and S&M are not affiliated with and do not endorse, authorize, sponsor, verify or monitor any of the listed websites or their respective sponsors, and they are not responsible or liable for the content of any website, or the collection or use of information regarding any website's users and/or members. Links are believed to be accurate at time of dissemination, but we make no guarantee, expressed or implied, to the accuracy of the links subsequently.
This may constitute a commercial email message under the CAN-SPAM Act of 2003. If you do not wish to receive marketing or advertising related email messages from us, please click the “unsubscribe” link within this email message. You will continue to receive emails from us related to servicing your account(s).
Sources:
https://www.bls.gov/news.release/cpi.nr0.htm
https://home.treasury.gov/resource-center/data-chart-center/interest-rates/TextView?type=daily_treasury_yield_curve&field_tdr_date_value_month=202304
https://www.bloomberg.com/news/articles/2023-04-09/end-may-be-in-sight-for-global-rate-hike-cycle-as-fed-nears-peak
https://www.npr.org/2023/01/24/1150319679/recession-slowdown-inflation-interest-rates-jobs-employment-economy
https://www.federalreserve.gov/monetarypolicy/fomcminutes20230322.htm
https://view.e.economist.com/?qs=945bdf0fef48265431723f8e67a3bac4cc6ba8a11ea6c83eae540fb660de54a2e234d27f2f6d212e27090a5bb3dcbf42ddc5d1108092a006a4946b60f29207d5de2d32ef670336e44020ad0567abff5c
https://www.barrons.com/articles/stock-market-needs-solid-bank-earnings-to-keep-rallying-so-far-so-good-47ae4d3e?refsec=the-trader&mod=topics_the-trader
https://www.history.com/this-day-in-history/apollo-13-returns-to-earth
https://home.treasury.gov/resource-center/data-chart-center/interest-rates/TextView?type=daily_treasury_yield_curve&field_tdr_date_value_month=202304
https://www.bloomberg.com/news/articles/2023-03-28/woolly-mammoth-meatball-created-by-lab-grown-meat-company-vow-foods?srnd=pursuits-vp
https://www.carsonwealth.com/insights/blog/market-commentary-the-bullish-signals-are-stacking-up/?utm_source=sfmc&utm_medium=email&utm_campaign=weekly-market-commentary&j=2182989&sfmc_sub=110820205&l=380_HTML&u=30550270&mid=100016897&jb=6
https://www.theatlantic.com/health/archive/2023/03/woolly-mammoth-meatball-stunt-food-marketing/673578/
https://www.sciencefocus.com/science/what-is-lab-grown-meat-a-scientist-explains-the-taste-production-and-safety-of-artificial-foods/
https://www.brainyquote.com/quotes/thomas_jefferson_141477
Would you like these weekly financial recaps personally delivered to your email inbox? Sign up here: